
This article is written by Dr Matthew Gregory, Senior Data Scientist GOV.UK and Ganesh Senthi, Senior Product Manager GOV.UK
Imagine you're trying to find some information online. It could be about more or less anything. You have scrolled through dozens of search results. But try as you might, you just can't find the information you need. Bored and frustrated, you give up.
This happens thousands and thousands of times each day, in countries around the world. And while it might be annoying for the individual, it’s also a big problem for society. Connecting people to the information they need is notoriously hard. But what if there was a better way to connect users to their desired content?
GOV.UK is the UK government’s trusted online communications and public services channel. It was launched in 2012 to combine almost 2,000 government websites into a single site.
GOV.UK supports nearly 30 million visits a week to find the information they need and to do the things they need to do with the government — like learning to drive, registering to vote or finding out what they need to do in response to COVID-19.
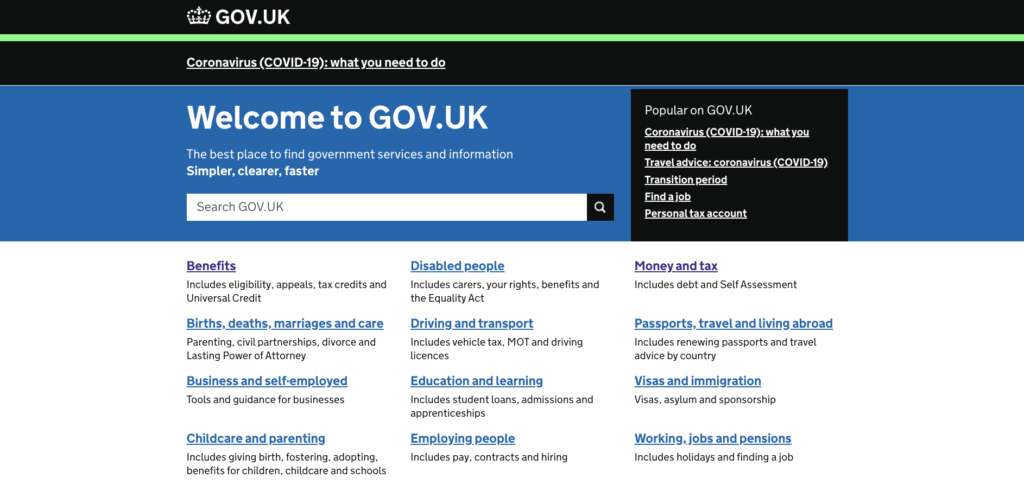
From renewing a passport to subscribing to travel advice notifications for an upcoming trip, the website effectively connects users to the information they need. But for the less everyday problems and information our users need extra support: there is a machine learning algorithm that connects the dots and enables people to find the information they need, when they need it.
Our problem
To help users get to the information they need, GOV.UK uses a number of navigational aids such as the search bar, breadcrumbs and related links. Related links are shown to the right-hand side of content on a page, linking to other pages which may be of interest.
Before we began working on this in 2019 only around 2% of the entire content on GOV.UK, or 8,000 pages, actually had related links. The rest had no related links at all.
This was a concern because observation and analytics have shown that good related links result in shorter user journeys, enabling users to find the content that they need faster. This is important because, if users don’t find the content they need quickly, they might give up. That might seem trivial if all GOV.UK did was help you renew your fishing license, but if someone gives up because they can’t find the right information to do their tax returns properly then the problem becomes a lot more serious.
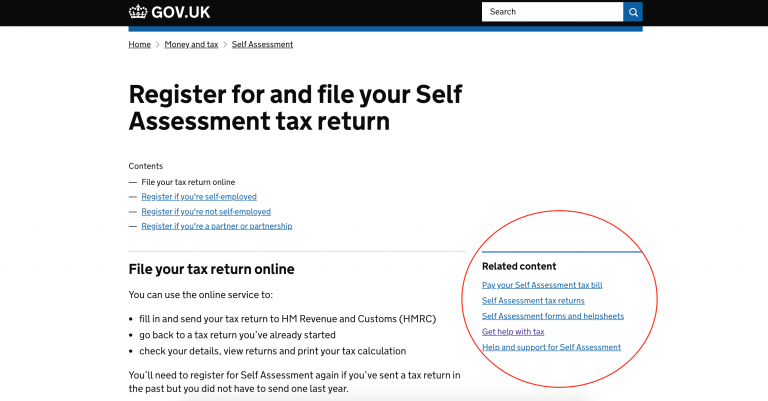
A screenshot of a GOV.UK page with related content links highlighted on the right-hand side
So, to improve users’ experience, we investigated whether we could use machine learning on GOV.UK to generate related links for the remaining 98% of content that had none. As a result of this experiment, we decided to implement the node2vec algorithm — we generated vector representations of nodes on our graph of user movement.
This was the first time the team behind GOV.UK had put a machine learning algorithm into production; no mean feat. To complete a difficult task like this you need the right people and skills. You need a multidisciplinary team that combines data science and user-centred design, one like GOV.UK Data Labs. And for additional technical detail about how we did it, please visit the blog here.
Here are some of the high level considerations that made this project successful and resulted in us sharing our success with academia and industry.
Defining the task using hypothesis driven design
Doing science in government is hard — we don’t sell stuff, so there’s not an obvious measure of success. How can we tell if a user has had a successful interaction with a related link during their visit to GOV.UK?
The first step for us when we started in 2019 was to define what we wanted to achieve. This then allowed us to assess whether the data was ready for the intended application.
- Want to write for us? Take a look at Apolitical’s guide for contributors
We also needed to build our team. Data science is a team sport so we needed the right people at the right time who together could carefully consider appropriate key performance indicators (KPIs) and state hypotheses clearly. The team started out with a data engineer and data science heavy team, then towards the end of the journey, as we moved towards production, became a more developer heavy team. We also worked closely with content developers throughout.
We defined our hypotheses through a series of carefully structured workshops, where we would combine domain experts’ knowledge with data scientist’s understanding of the available data. The output of these workshops were a selection of “sorta-hypotheses” that said something interesting about related links and how our users interact with them. The data scientists could then translate these into testable statistical hypotheses.
These “null hypotheses” assume that nothing interesting is going to happen; the related links produced by the algorithm do not change user navigation (we omit the detailed hypotheses here). We then design an experiment using robust statistical methodology to test these null hypotheses. We use the scientific method to ratchet GOV.UK towards an optimal design.
Choosing an algorithm
With our statistical hypotheses in place, we needed to start producing the actual related links.
We used two approaches that used different kinds of data and algorithms to generate recommended related links for a page.
The first one can be explained using the analogy of a human. If you gave a human several different pieces of content from GOV.UK, they could read the words on each page, understand the meaning and then score how similar they were to one another. An algorithm can do the same. However, for the algorithm to “understand” the words on each page, we help it by preprocessing the data and representing the content numerically. See our blog post for more detail.
Cleaning and organising the data ready for consumption by an algorithm is hard and always takes longer than you think
The second approach is to look at what people have done historically. Given what we know about where users go in journeys that visit that same page, what pages might we recommend to them? This intuition comes from recommendation engines. For instance, if users tend to inspect the fishing rod rules on GOV.UK in the same journey where they apply for a fishing rod license, we can provide this link for them automagically.
Given these approaches rely on two different data sets, we needed at least two different algorithms to train a model that can then predict related links. To identify candidate algorithms, the data scientists did literature review of the problem domain and the type of data that we had available to us. In the end, we decided on two::
- The Universal Sentence Encoder: encodes text into high dimensional vectors that can be used for semantic/content similarity comparison.
- Node2vec: can learn useful representations of a graph.
Preparing the data
While the team were weighing the pros and cons of different algorithms we also had to clean the data to make sure it was in workable condition.
Data is not always in a good state for the different ML algorithms, or algos as they are often referred to for short. You need to ensure it is “ready” and get it in the “right shape”. You need to clean it and pre-process it, similar to preparing ingredients for your favourite recipe.
Cleaning and organising the data ready for consumption by an algorithm is hard and always takes longer than you think.
Ensure you give your team adequate time to do the data engineering and pre-processing. This will save you time in the long run — the data scientists can help delivery managers understand the time required and risk of a project by using data readiness levels. Understanding data readiness levels can help a team prioritise projects by tackling projects where data is in a better shape whilst wrangling data for later down the line.
We spent several months on data engineering and preprocessing before training our models. A diverse team, like GOV.UK Data Labs, can help deliver this more quickly. Check out the Digital, Data and Technology framework, to see descriptions of the sorts of roles involved.
Data + algorithm = model
Once you’ve readied the data, you might be tempted to train complex algorithms such a deep learning neural network. We too fell foul of this temptation which resulted in us wasting time.
Instead, we recommend sticking to tried and tested approaches, as well as including a simple baseline to ascertain whether the more complex algorithms are worth the effort. For instance, if you are creating an algorithm to recommend content, then you can simply count which page most frequently occurs in user journeys that contain the page you are predicting for (the log likelihood ratio). This is helpful because it gives you a frame of reference to compare your algorithm to.
By feeding our data into an algorithm we produce a model.
Comparing to human-level performance
Now that we had some working models, the next step was to test whether they were any good.
The “Pepsi challenge” can be a good starting point for assessing the predictions of your trained models. Essentially, you review two different spreadsheets of related links; links produced by humans versus links produced by the model. If you struggle to tell them apart, you know the model is doing alright!
We extended this logic and had domain experts review the links produced by the different models. At which point one of our content designers quipped: “I for one welcome my robot overlords!”
Evaluation with the scientific method
The assessment using expert opinion is subjective (and limited to reviewing a few hundred pages). For an objective assessment at scale, we can use the vast numbers of users that visit GOV.UK, and their interaction with the links produced by these models to experimentally ascertain whether the user experience is improved.
Like most websites we use user analytics (i.e. cookies) to track where users went and what they did (see here for how Cookies are used on our site). For the assessment, we randomly assigned users to two buckets, A or B. We showed users in bucket A the original page on the site, and showed users in bucket B the page with the model generated related links. We then analysed the user journey data using statistics to infer the impact of the changes by comparing the differences between A and B. For a deep dive into how we A/B test see our blog post.
We found that both algorithms improved things for the user compared to the original page — but which algorithm was superior? We found out that users were more likely to click on related links provided by the node2vec algorithm (trained on where other users had been) than related links produced by the content similarity method (trained by identifying content with similar words). This gave us the confirmation that we needed that the ML algorithm had indeed improved the user experience and it also helped us determine which algorithm we should go live with.
Making a decision
After developing and testing different models to solve our problem, it came time to choose the one we’d invest in. When choosing your model there are other things to consider in addition to the statistical significance in the A/B test. Perhaps the fanciest algo did best, but if it requires a lot of computing power it might not be worth the extra effort if the gains are small; simple models that do the job well enough might be easier to get live on your site.
When deploying a ML system for the first time in an organisation, it’s prudent to be conservative. We had a roll back system, so at the flick of a switch, we could revert back to previous links
You might also want predicted related links that change with the times and user behaviour. That’s why we opted for node2vec, as it is trained on the last few weeks of user journeys, thus it can cope with seasonal changes and user behaviour changes associated with crises like COVID-19.
Our simple baseline performed pretty well, but it pretty soon hit the ceiling of what it could do. Machine learning algorithms, in contrast, can be fine tuned and tinkered with through iteration to improve outcomes. Thus there was more scope for improvement with node2vec.
Deployment
Deploying machine learning products to production is always the trickiest part of the process. It’s very, very, very hard, as this paper covers in really good detail.
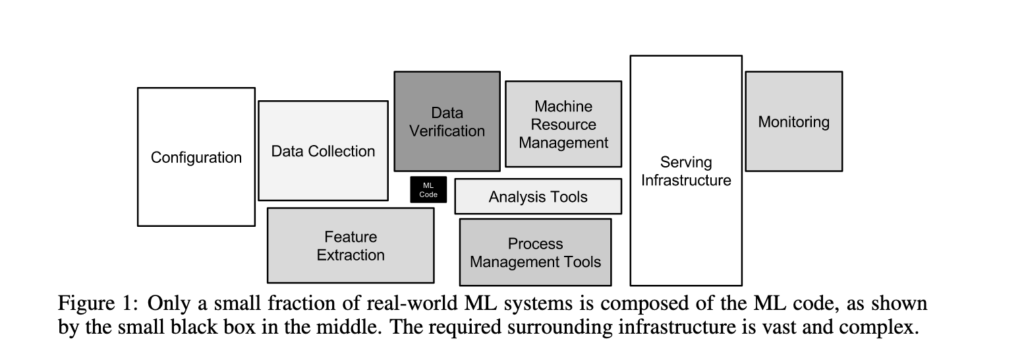
All the code that goes into an ML algorithm (Image credit: Scully et al, 2015)
Only a small fraction of real-world ML systems is composed of ML code, as shown by the small black box in the middle. The required surrounding infrastructure is vast and complex. We’ve touched on the other various components to the left of the ML code box (and Analysis Tools - A/B testing). Now we consider the right hand side.
Managing machines and serving the infrastructure is a massive feat in itself AKA productionising the ML system. This is detailed more fully in our “data in government” blog post. To productionise, at its simplest, can simply mean to move some algorithm or software into an environment where it’s used to shape the outcome of a process, later consumed by users. When applied to data science, this involves creating a joined-up and automated pipeline from individual steps, such as obtaining input data, running a machine learning algorithm and creating useful output data (related links for every page on the site).
Ongoing support and iteration
As the machine learning (ML) community continues to accumulate years of experience with live systems, a wide-spread and uncomfortable trend has emerged: developing and deploying ML systems is relatively fast and cheap, but maintaining them over time is difficult and expensive. This is further compounded by the desire to get your talented team to work on automating other things.
Once it goes live, it’s not over! We monitored the quality of the links and responded to feedback. ML is not magic nor a silver bullet, if it makes some stupid recommendations, you need a feedback mechanism from users and metrics to monitor performance as the world changes.
When deploying a ML system for the first time in an organisation, it’s prudent to be conservative. We had a roll back system, so at the flick of a switch, we could revert back to previous links.
Running periodic A/B tests of your ML system versus an alternative is a sensible thing to do, ensuring that it still benefits your users.
Spotting good data science problems
For the GOV.UK Data Labs team to be effective, our people needed to have great domain expertise. This has been achieved by handling business requests alongside our team's main work strands, such as related links production. This positions our team to recognise and exploit business opportunities to ensure more efficient and effective ways to use data science. These improvements will usually manifest as automation or augmentation of business processes.
An informal audit of business problems can provide a useful starting point for identifying low hanging fruit that can have immediate impact and raise the profile of the team. Essentially you are scouting for a repetitive task that is tightly constrained and for which there is plenty of data about the process; a manual task that cannot be scaled.
We’ve also learnt to not be constrained by user needs, it’s OK to be proactive and experiment!
Alongside these quick wins, it’s useful to have work strands that address some of the more fundamental business problems you have. Your team should be adhering to Agile principles, using spikes (short forays into a problem area) to assess feasibility, priority and whether it’s worth putting more people on.
For the GOV.UK Data Labs team to be effective, it’s important to know the business well. We regularly have our people embed in other teams for short periods. An informal audit of business problems can also help identify quick wins. This can build the profile of the team while you continue to dedicate people to more fundamental business problems. We have the right people focused on building the data backend that will power the GOV.UK vision.
We’ve also learnt to not be constrained by user needs, it’s OK to be proactive and experiment! Especially in the modern era, with some great ideas and open source code publicly available to experiment with. When experimenting, present potential users with all the data, exposing the data allows you to formulate requirements. Coming at the same problem from a different angle to traditional user research.
By looking outward to other organisations, we can draw inspiration. We observed how they recommend and serve content to their users automatically, this got us thinking about automating tasks that used to take up a lot of our content experts’ time.
The Data Revolution
The digital world is rapidly changing, and with it, our users’ expectations of how they should be interacting with government services and information. Last year, the head of GOV,UK, Jen Allum, set out the GOV.UK vision on how we will meet these expectations. At the heart of this vision is transforming the way we use data on GOV.UK.
This focused effort has helped us work out what problems to solve, identify what things we can automate for the GOV.UK programme and for our users. We look forward to continuing doing all of these things and more. - Matthew Gregory and Ganesh Senthi
Further reading / useful links:
- Detecting semantic similarity on GOV.UK
- Connecting the dots: network science on GOV.UK
- A or B? How we test algorithms on GOV.UK
- When worlds collide: putting data science into production
- Introducing the GOV.UK Data Labs
We want to hear what you think about this article. Pitch an article to us or send your comments to hello@apolitical.co
(Picture credit: Unsplash)
Make sure to share your own thoughts with the author by leaving a comment below

Log in or sign up to continue the conversation