
This article is written by Yiğit Aksakoglu, Former Turkey representative, Bernard van Leer Foundation
Almost 5 years ago my daughter, who was 3 at the time, wanted me to go out with her to play in the snow. I was preparing a presentation about young children in the city. So I asked her, “What do you think we, as a family, need in this city?”
She didn’t think twice. “I need to go to school, you need to go to work. We need roads to travel. We need lots of parks to go for picnicking. I need sidewalks to ride my tricycle. But I also need someone to put ice on my knees if I fall.”
- Want to write for us? Take a look at Apolitical’s guide for contributors
She didn’t know it, but her description fit the definition of a liveable city perfectly.
We adults know that if our cities are not liveable for young children and their caregivers, it is not liveable for anyone. Unfortunately, few cities are designed with children in mind. So how can we overcome this challenge?
As part of the Bernard van Leer Foundation’s Urban95 global strategy, which challenges policymakers at city level and urban planners to look at their city from the perspective of someone who is 95 cm tall — the average height of a 3-year-old — we have initiated a program in Turkey called Istanbul95.
We realised that the problem wasn’t a lack of data. Instead, it was a matter of making the right people see what that data looked like in real life.
Istanbul is Europe’s largest city and home to 15 million people spread out across 39 districts/municipalities. Unfortunately, the city also ranks high in the number of traffic jams, low in air quality and low in quality of life in general
When we started this program 4 years ago, the view on Istanbul from 95cm was not very encouraging. Istanbul is Europe’s largest city and home to 15 million people spread out across 39 districts/municipalities. Unfortunately, the city also ranks high in the number of traffic jams, low in air quality and low in quality of life in general. There was — and still is — a lot to improve. The statistics we found about children were also not very promising.
Istanbul is home to a total of 1,2 million infants and toddlers under the age of 4, and 230.000 babies are born every year. Despite this, we couldn’t find any investment specifically for young children in the municipal budgets, but we did find approximately $40 million USD per year allocated for funeral services at the metropolitan municipality level.
Istanbul’s children
We wanted to improve the wellbeing of these children, but first we needed to locate them. We asked ourselves: Where are the disadvantaged children in Istanbul? What services are they able to receive — and which are they lacking?
To help us answer those questions, we enlisted the help of Professor Murat Güvenç from Kadir Has University’s Istanbul Studies Center (ISC). Professor Güvenç offered to help us by combining two sets of data for an initial mapping effort. The first data point his team at ISC used is the property prices per square meter, which is collected by district municipalities in order to collect property tax.
As Professor Güvenç told us, property prices are a strong proxy indicator for household income. He then suggested we combine that data with the National Statistics Institute’s age group data on neighbourhood level. By combining the two different sets of data, it would show us the concentration of young children in disadvantaged neighbourhoods.
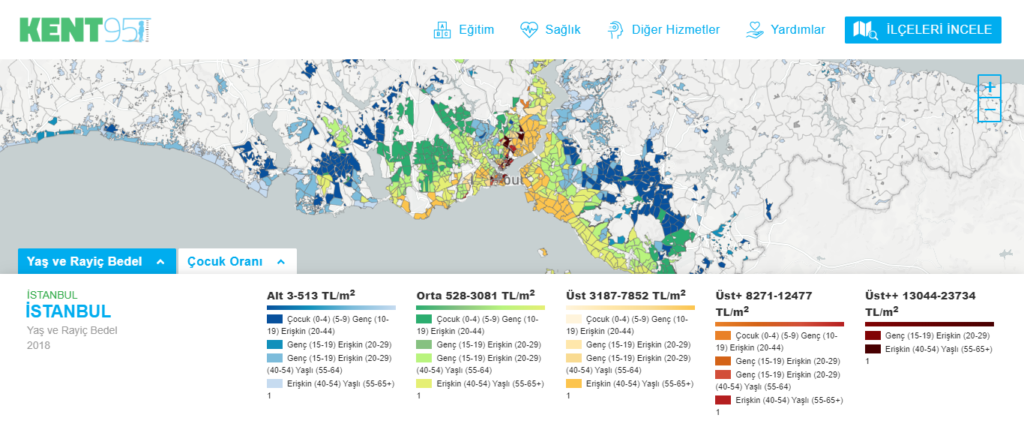
This map, which has been developed by professor Güvenç’s ISC team, shows where Istanbul’s disadvantaged children are. The dark blue indicates neighbourhoods with lower property price per square metre and high number of children in the 0-4 age group. The dark red areas are neighbourhoods where the property prices are higher and there are fewer children in the 0-4 age group. By using only these 2 indicators, the map shows the socio-economic distribution of children in the city by neighbourhoods and also how major roads have an effect on the distribution of wealth in urban settings.
This project started with the aim of improving city life for young children and their caregivers, but its value reaches much further than that. For example, the maps can also help policymakers see where the highest rates of maternal depression are likely to be, as child poverty and maternal depression correlate, and it can also be used to provide better services for senior citizens or youth.
To get an even more detailed picture, we have also worked with the Turkish Economic and Social Studies Foundation (TESEV) to collect service and infrastructure data from district municipalities. This has made it possible for us to create 39 interactive district maps, comparing neighbourhoods within the district and showing services and infrastructure available based on data collected from district municipalities.
From map to policy
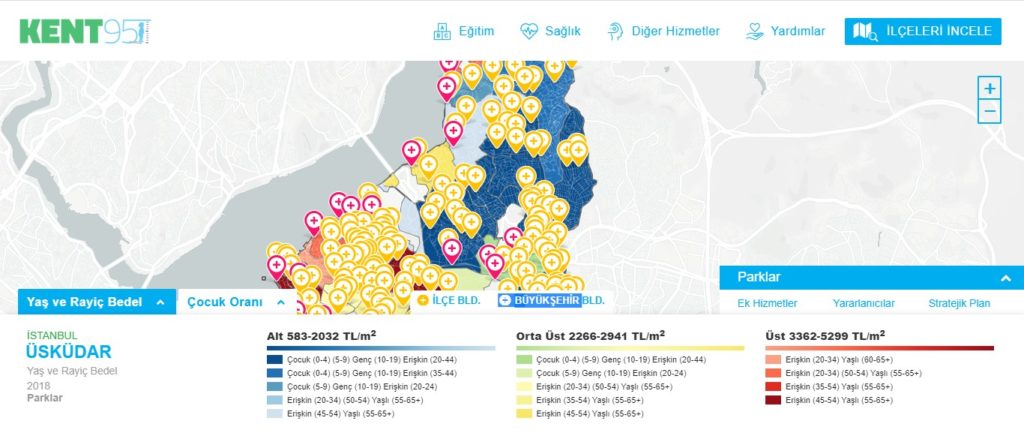
For example, in the image below you can see an overview of Üsküdar district. Indicated once again in dark blue, the map shows us where the disadvantaged children live as well as the distribution of the local district municipality parks and metropolitan municipality parks indicated by the yellow and red pins respectively.
As is evident from just a quick glance at this map, the poor neighbourhoods have the fewest parks, depriving these children of opportunities to play outside like their peers even within the same district. These same maps also indicate where women with young children have more chances to go out and meet their peers.
In the words of Professor Güvenç, maps increase the quality of information that’s already available. This is a crucial part of delivering better public services and is the reason why this is more than just a pretty visualisation.
We use these maps actively to improve the lives of the people who live there, using the information the maps give us to inform our approach. Two examples from our Istanbul95 program stand out: a home visiting program and a public space improvement program.
In our home visiting program, we try to reach disadvantaged pregnant mothers and to provide parent coaching services in their homes in collaboration with Boğaziçi University and the local municipality. The academic team at the university developed content, curriculum, training and consultancy for the municipalities, who provide the coaching.
The goal was to show how these managers, as well as others, can improve the design and use of parks and public spaces
The component of our program that focused on improving public spaces targeted capacity building among municipal staff, especially in the parks and garden departments. The goal was to show how these managers, as well as others, can improve the design and use of parks and public spaces for a use by young children and their caregivers.
Both these projects wouldn’t have been possible if we hadn’t first identified where the biggest needs were — whether it be a need for improved playgrounds for young children or a helping hand to expecting mothers.
The maps have also helped the public servants we work with gain new insights.
When we first shared the map showing the distribution of parks to the head of parks and gardens at one of our partners at the municipality, she was simply stunned. Her district has around 600.000 inhabitants, and the manager is responsible for 150 parks of various sizes and maintenance needs.
She was of course very busy with repairing, improving and opening new parks. But while she was aware of how parks were distributed geographically, she had never seen them as they were spread out socio-economically. The maps allow decision-makers to better understand how they can improve their work by being more precise about the target groups and to see the impact of their work after intervention.
A global trend in the making?
Following the recent local elections in 2019, we have begun a new partnership with Istanbul’s Metropolitan Municipality.
The new mayor and his team who took office following the 2019 elections were very open to collaborating and actively asked for the maps at the metropolitan level. We’ve begun working on new maps, which include services and infrastructure at the metropolitan municipality level and central government services such as health and education. Together with TESEV, we have also developed specific maps for different departments of the metropolitan municipality, such as for parks and gardens, which can help decide where to establish new parks and for family support centres on where to open new centres and where to target their pilot home visiting program.
These maps have raised the interest among policymakers in data-driven decision-making tools, and we’ve received requests from other major municipalities like Izmir and Ankara for similar visualisations. But this approach has value far beyond Turkey’s borders. The maps developed by the ISC and TESEV can be easily replicated in other cities.
And these cities can also be creative and develop new maps targeting different policies. For example, in the ongoing COVID-19 pandemic, these maps also indicate high-risk populations and can be used to take different measures in different neighbourhoods.
Look for problems, not data
When it comes to data and data visualisation, I believe the starting point should be the problem itself and not the available data. Even if the exact data you’re looking for isn’t available, you can usually find a proxy indicator. Once you know which problem you want to solve, find a partner who can help you. We didn’t have the necessary technical skills to create these maps, but we found the experts who did and brought it to the attention of the people in government with the power to change things.
Maps like these are actually a relatively easy and low-cost tool that enables the decision-makers not only make the initial decisions but also follow up the impact of their decisions if they can regularly update the data on the maps.
The main challenge that we and our partners now face is ensuring the longevity and the uptake of the maps
The main challenge that we and our partners now face is ensuring the longevity and the uptake of the maps. The maps are initiated and maintained through external funding and support and, therefore, both ISC and TESEV are in the process of handing over the maps to relevant municipalities through a series of training programs and developing a dashboard for managers to increase the frequency of use.
I’ve even had the opportunity to use these maps personally, though the results weren’t too encouraging.
When my family and I moved to our current house in a busy neighbourhood in central Istanbul, I had to use the map of our district to find the closest park. It wasn’t too promising. It was mainly a piece of concrete with a couple of swings and slides.
I think we still have a lot of work to do in our cities to raise the living standards and create space for the lives that our 3-year olds can describe so easily. — Yiğit Aksakoglu
(Picture Credit: Unsplash)
Make sure to share your own thoughts with the author by leaving a comment below

Log in or sign up to continue the conversation