
This article was written by Becky Ofrane, Manager of Engagement & Partnerships, City Health Dashboard
The Covid-19 pandemic is the latest health crisis to highlight disparities among neighbourhoods. From obesity and opioid-related deaths to Covid-19, certain populations carry a greater risk and burden of disease, often concentrated in a neighbourhood just a few blocks away from healthier and wealthier counterparts.
- Want to write for us? Take a look at Apolitical's guide for contributors
Cities and local governments can target resources towards the most vulnerable residents by understanding the neighbourhood-level social and economic drivers of health, in addition to critical health outcomes for residents.
Cities need data in order to understand the state of housing and the built environment, as well as other drivers of health
From data to action
In the U.S., more than 80% of us live in urban areas.
City governments oversee health programs and policies, like developing more safe, affordable housing or building connected activity paths and parks in underserved neighbourhoods. Cities need data in order to understand the state of housing and the built environment, as well as other drivers of health.
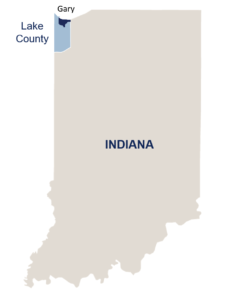
But until recently, few measures have been available at the city level for leaders to assess health and the factors that shape it, relying instead on county-level data, which have been more readily available. For example, the obesity rate for residents of Gary, Indiana is almost fifty per cent, significantly higher than Gary’s encompassing county (Lake County, at 35% obesity) and Indiana overall (33%). These hyperlocal variations and needs are exactly the problem the City Health Dashboard was developed to solve.
Launched in 2018, the Dashboard is a free online tool that provides city- and neighbourhood-level data on 35+ measures of health, such as diabetes rates and life expectancy, and its drivers, like healthy food access, high school graduation rates, and residential segregation, for over 750 U.S. cities.
The Dashboard’s data also empower cities to take action on the health issues they uncover. The Dashboard’s curated Take Action resources empower cities to identify and intervene upon health challenges by providing a path forward based on identified challenges.
So, how are cities using it? Here are two examples.
Becoming a nationally accredited public health department in Clifton, NJ
Until recently, the Health Department in Clifton, New Jersey (population ~85,000) had to rely on county-level data from Passaic County for planning its health programming. But for a city as racially, ethnically, and socioeconomically diverse as Clifton, this information was too broad to truly reflect residents’ health which is often driven by neighbourhood dynamics.
The Dashboard’s data also empower cities to take action on the health issues they uncover
The Health Department now uses the Dashboard to drill down into the city’s neighbourhood data to provide the clarity and granularity they previously lacked. They’ve been able to use the Dashboard’s quantitative data alongside qualitative surveys from local community health organizations, to highlight disparities in obesity and uninsured residents across the city for their Community Health Assessment, part of the process to help them become a nationally accredited local public health department. Additionally, the Clifton City Council recently approved a satellite health office in a neighbourhood identified as high-need using Dashboard data. This health office will provide screenings, immunizations, social services case management, human resources outreach, and neighbourhood safety services to a community that had lacked access to health care and been traditionally underserved by city services.
Refocusing priorities in Providence, Rhode Island
Roughly 200 miles northeast of Clifton, the Healthy Communities Office in Providence, Rhode Island (population ~180,000) uses the Dashboard to address low rates of physical activity in underserved areas.
They discovered that walkability and safety concerns had a greater influence on low activity than obesity itself, which had previously been thought to be its major driver. The Dashboard data on walkability were then combined with state data on bikeability to identify barriers and opportunities for increased physical activity in specific neighbourhoods and spur the design of more safe and walkable streets.
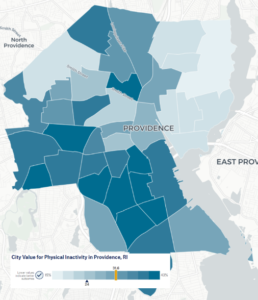 Physical inactivity varies across the city, ranging from 16.9% of residents reporting NO physical activity in the northeast part of the city to 41.5% just south of the city centre.
Getting started with data
While the Dashboard has something for every city, regardless of resources and government data capacity, some cities are most primed to see the greatest impact in their work and the bottom line. Small and midsize cities who might not have an endless budget for collecting their own data, can benefit from using City Health Dashboard data to direct resources and support strategies for local data collection. Cities implementing Health in All Policies can use the Dashboard in their efforts to integrate health, well-being and equity into the development of programs not traditionally health-related. And finally, cities who are looking to bring players to the table in new ways can leverage Dashboard data and visuals to reach diverse communities, departments, and sectors and unite them around building comprehensive, sustainable solutions for health challenges.
We invite you to explore your city on the City Health Dashboard and harness the power of data to create change in your community, neighbourhood by neighbourhood. Dive right in, or use our Data Explorer Worksheet to walk through the site step-by-step. Let us know what’s working in your city, or get answers to your Dashboard questions by emailing us. — Becky Ofrane
(Picture credit: Unsplash )
Make sure to share your own thoughts with the author by leaving a comment below

Log in or sign up to continue the conversation