
This article is written by Aiden Liu, a computer science student at Columbia University, Basil J. White, a policy analyst for a US federal cabinet agency, and Beth A. Martin, an adjunct instructor and user experience (UX) practitioner.
The problem: Relational databases require analysts to manually generate connections between data points and extra data can’t be added at a later date.
Why it matters: Making manual connections when working with relational databases takes time - which can be very inefficient when working with volumes of data.
The solution: Graph databases automatically produce data connections, allow for extra data to be subsequently added, and can significantly improve efficiency.
Make the most of your spreadsheets
Do you have an inefficient spreadsheet that stores all your clients’ information? Imagine that you could create a client data table that stores each client’s name, ID, and company address. Imagine that you also have a transaction data table that stores each client’s ID and past transactions. Since both tables contain the client’s ID, we could link the two tables together based on this common item [Figure 1].

Figure 1: Client data table and transaction data table
Create a relational database
This scenario illustrates how a relational database that organises data into tables (client and transaction data tables) links them based on a common data element (client ID). Relational databases are standard practice in organising data today - seven of the ten most popular databases in 2021 are relational databases. In a relational database, you can do simple operations, such as search for a specific client, to more complex operations, such as join tables together by the common data as we described above. Relational databases, however, have their limits:
(1) They do not identify and generate data connections across data tables automatically. Rather, you must manually join two tables together to find data connections.
(2) Once relational databases are built, you cannot add new attributes to the data. From our example above, you cannot add new data (or an ‘attribute’), such as the client's job title.
See the visual hierarchy
One alternative to a relational database is a hierarchical database. Unlike relational databases, which organise data into tables with rows and columns, graph databases organise data into a family-tree-like taxonomy. Each data point is represented as a node (or a tree leaf) instead of a row in the table, and they are automatically connected to each other by an edge (or a tree branch) based on common items [Figure 2]. The more data you add into the graph database, the more nodes and edges will be generated. Let us use the client data mentioned above again to understand how a graph database works. Each client’s name becomes a node; their ID, company address, or any attributes that are added later are represented as nodes that are automatically connected together by edges.

Figure 2: Nodes (data points) that are connected by edges in a graph database
Take advantage of new insights
Because of the automatic generation of connections between data, you can use graph databases to identify previously unknown connections. Let us consider an example where analysts use data to allocate COVID-19 relief funds to applicants. Traditionally, with relational databases, analysts need to gather data from different government departments, since the applicant’s personal information might appear in multiple data tables, such as data tables on employment, housing, and bank account summaries [Figure 3]. Analysts would search each database manually to identify data points related to the applicant. For example, has the applicant received funds from other sources before? Was the applicant covered by any medical insurance?
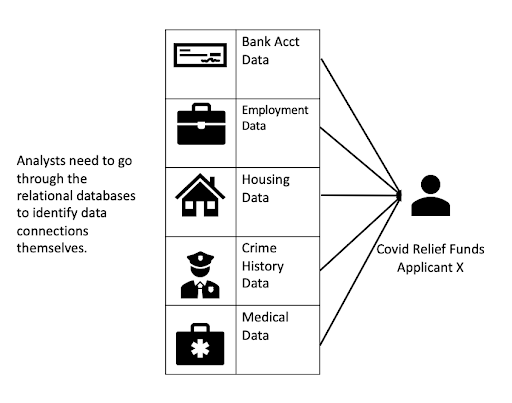
Figure 3: Search through relational databases on a COVID-19 relief funds applicant’s information
After the manual examination of those data points, analysts need to integrate those data points to see if they are connected in some way to determine the applicant’s qualifications and specific needs. The real work is much more than the illustration above. Relational databases do not identify data connections; with graph databases, however, you only need to upload all the data, and let the databases do all the hard work to visualise the data connections. The final graph might look like [Figure 4].
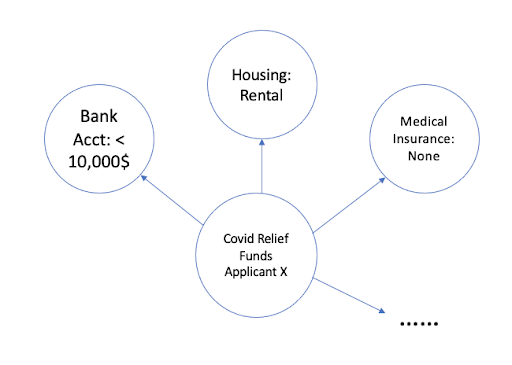
Figure 4: Search through graph databases on a COVID-19 relief funds applicant’s information
With this graph database, analysts can easily tell that the applicant X is qualified for the COVID-19 relief funds based on the connected data.
Our key takeaway
For analysts who deal with thousands of data points everyday, graph databases will automatically visualise those data points into tree-like graphs, which enables understanding of the relationships between data points. This is a remarkable advantage over relational databases, since the latter requires analysts to manually identify and generate connections between data points.
Graph visualisation significantly improves data analysis efficiency, as it reduces the time for search and data connection. It enables you to make decisions directly based on the identified data connections.
👋 You can create a post like this one! Share your thoughts with a community of public servants. Learn more
(Image Credit: Unsplash)
Make sure to share your own thoughts with the author by leaving a comment below

Log in or sign up to continue the conversation